Graphical (Package Name: com.vernier.graphicalanalysis) is developed by Vernier Science Education and the latest version of Graphical Analysis 6.1.0 was updated on September 8, 2025. Graphical Analysis is in the category of Education. You can check all apps from the developer of Graphical Analysis and find 200 alternative apps to Graphical Analysis on Android. Currently this app is for free. This app can be downloaded on Android 10.0+ on APKFab or Google Play. All APK/XAPK files on APKFab.com are original and 100% safe with fast download.
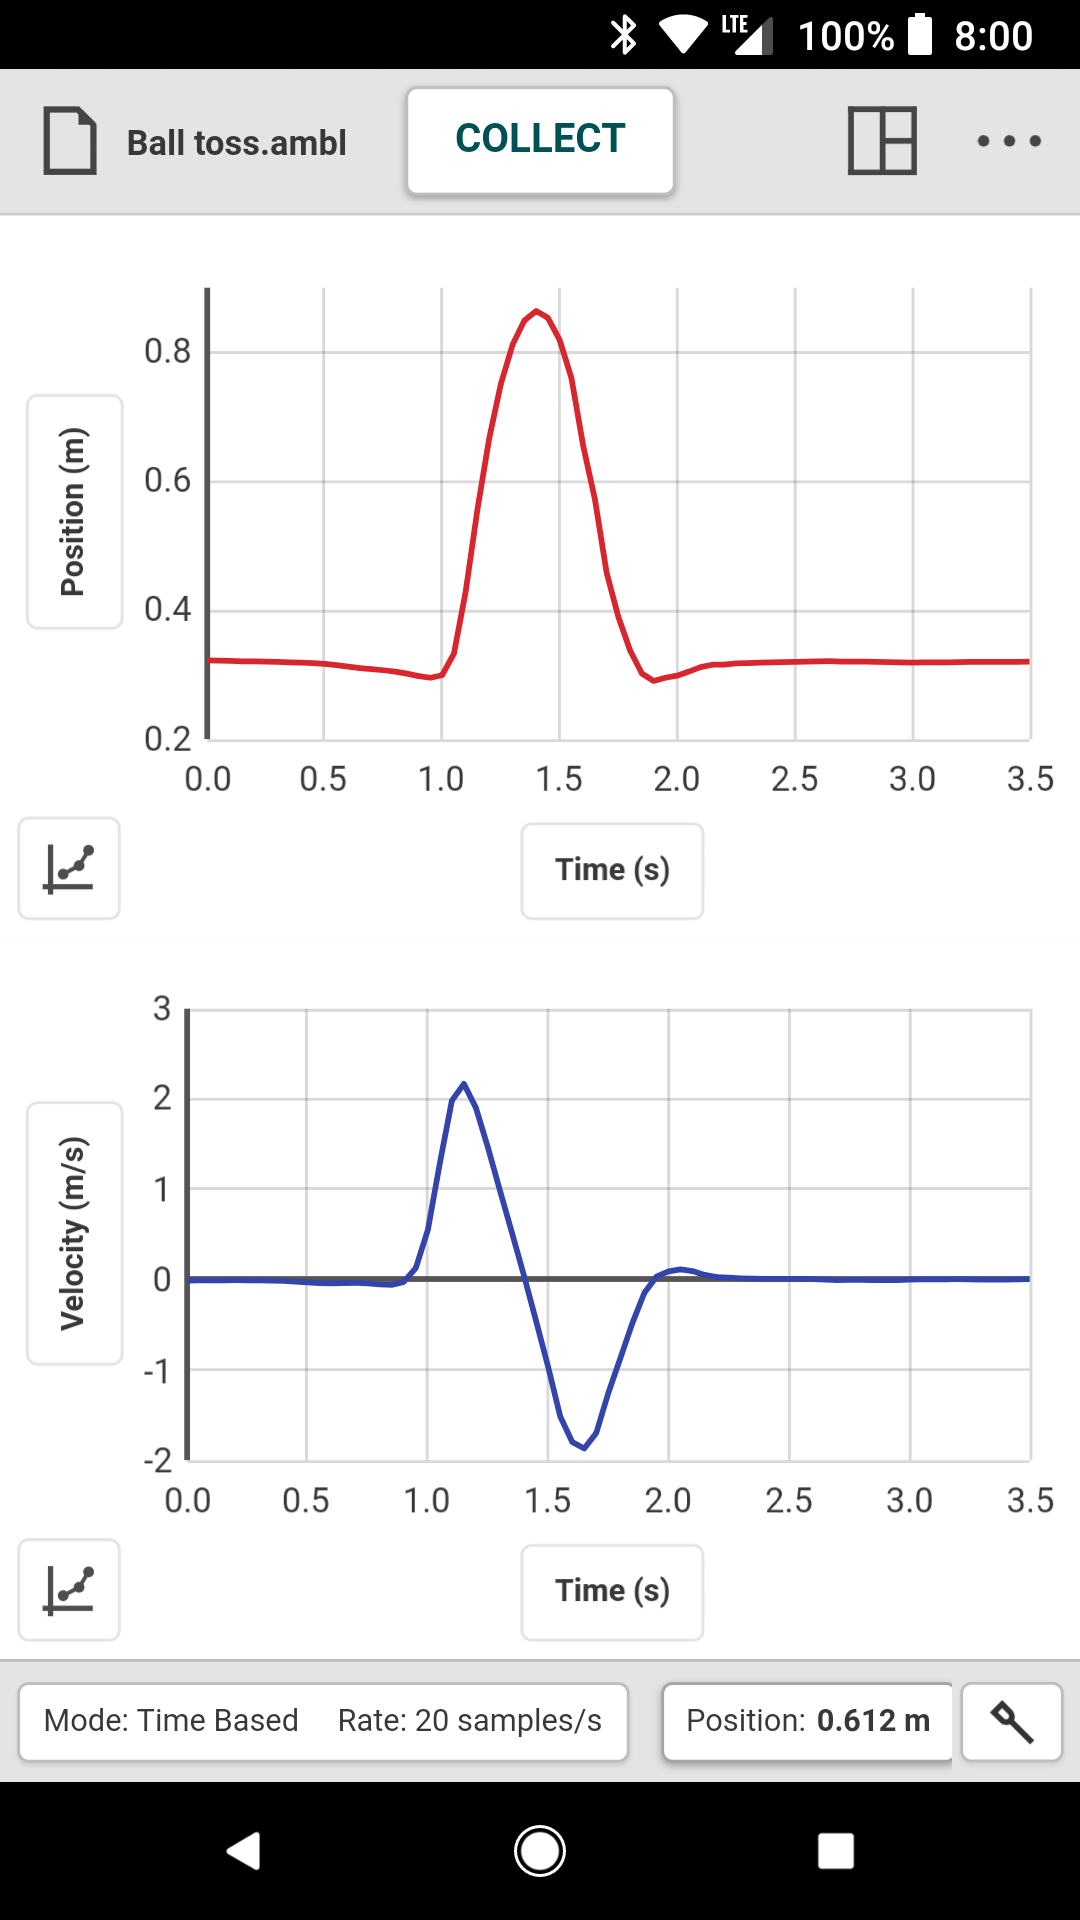
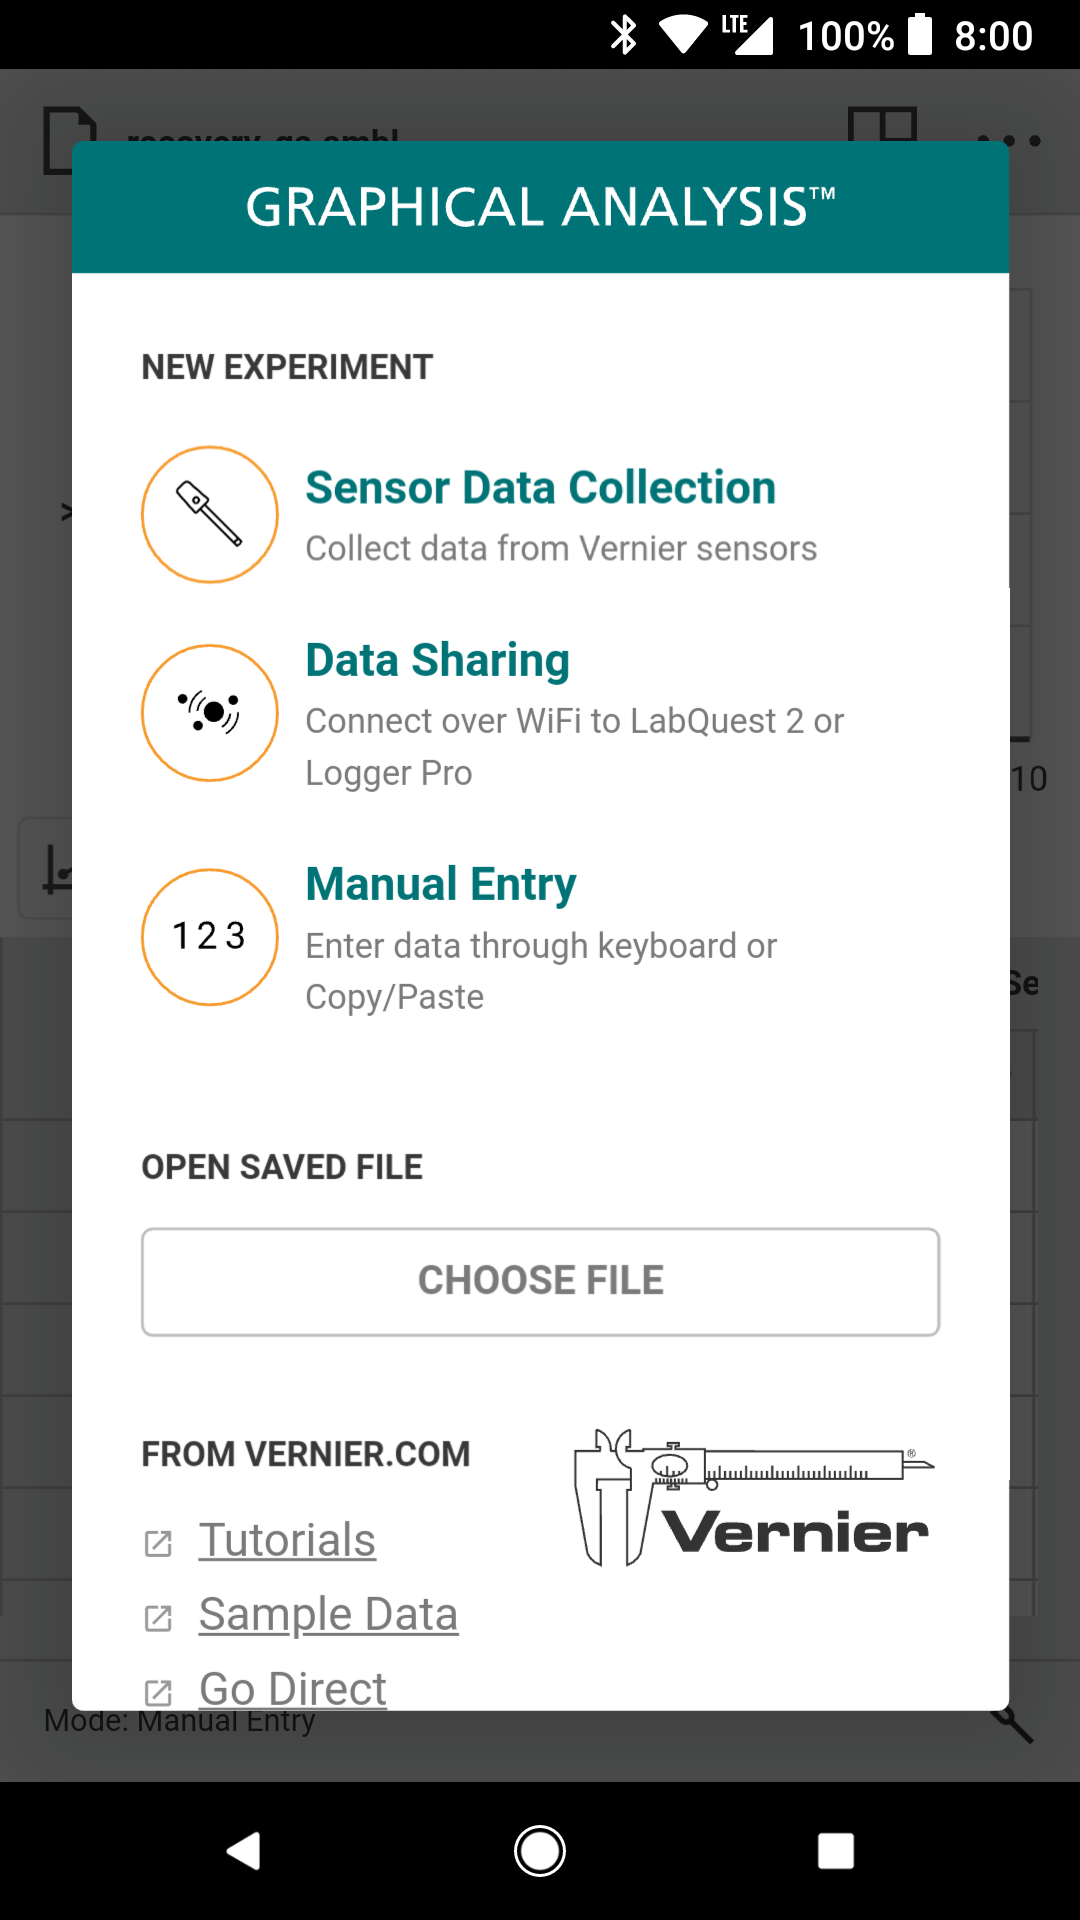
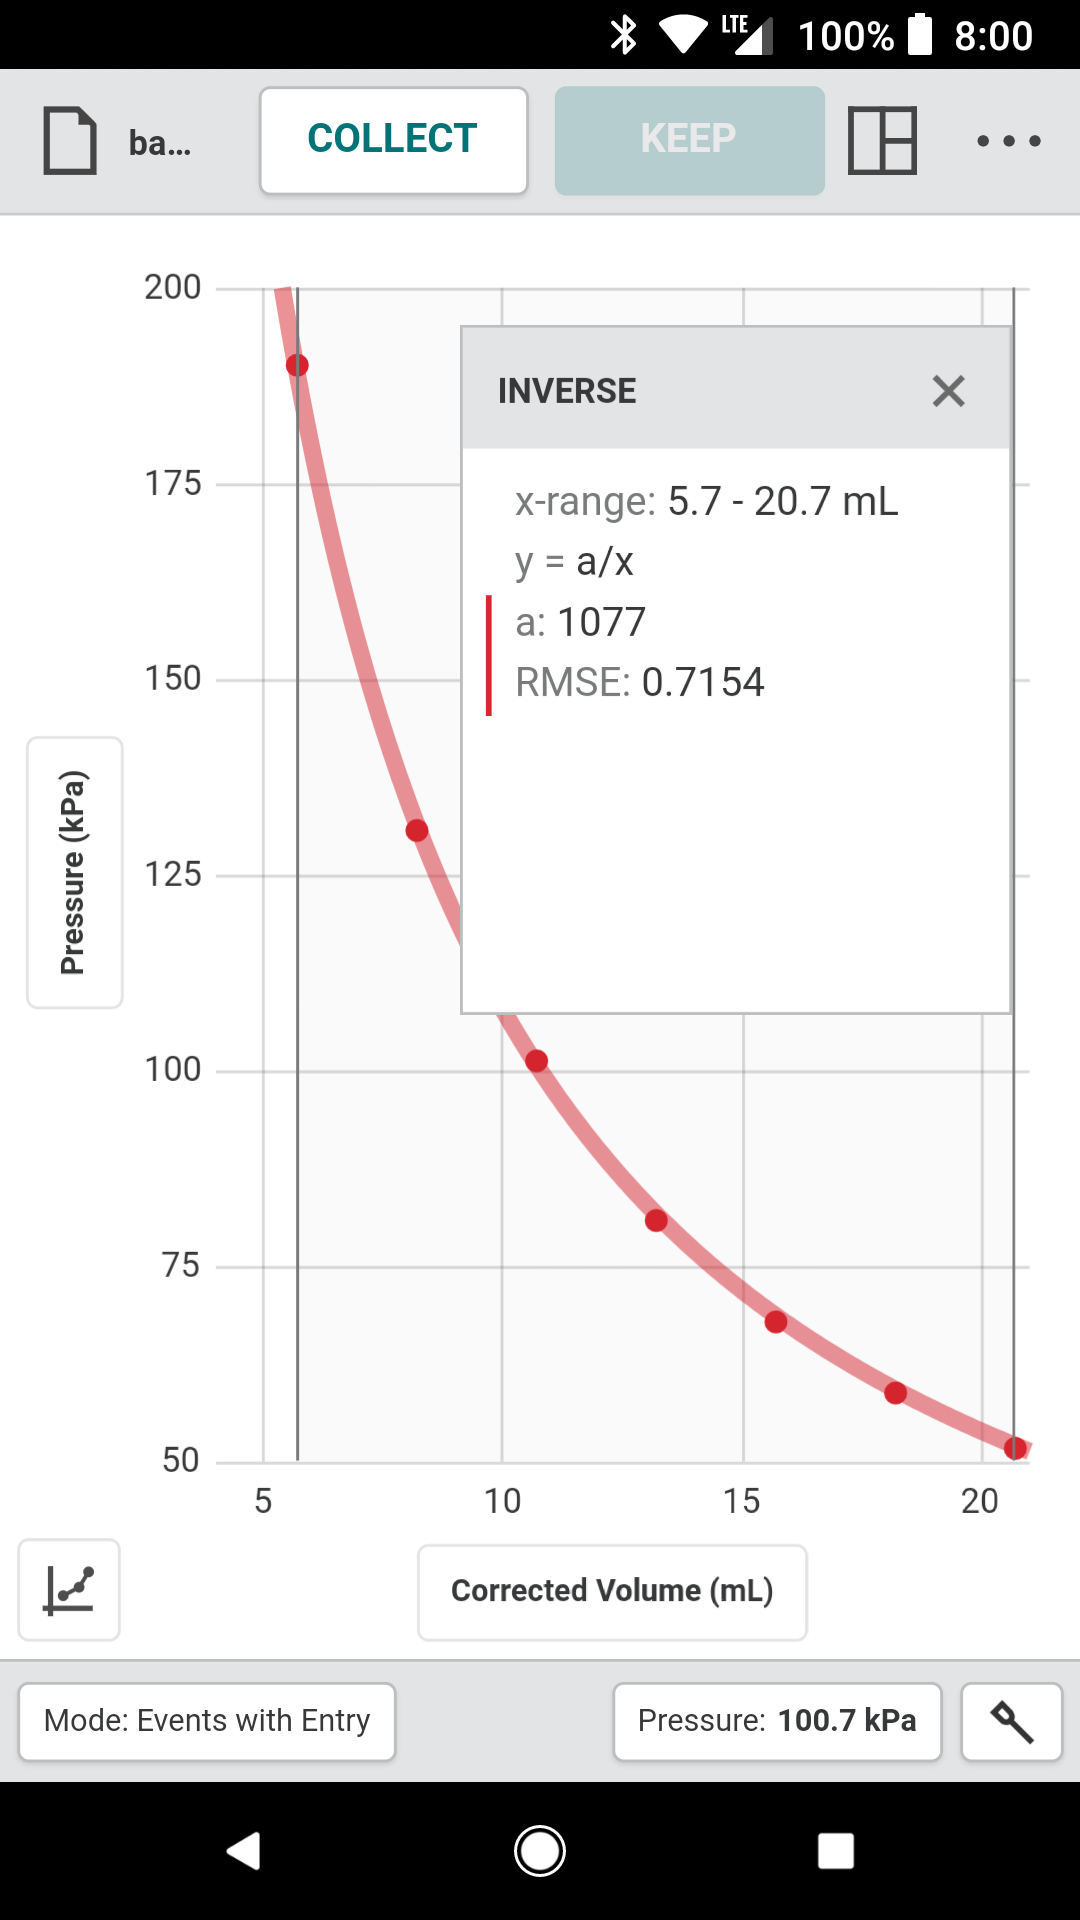
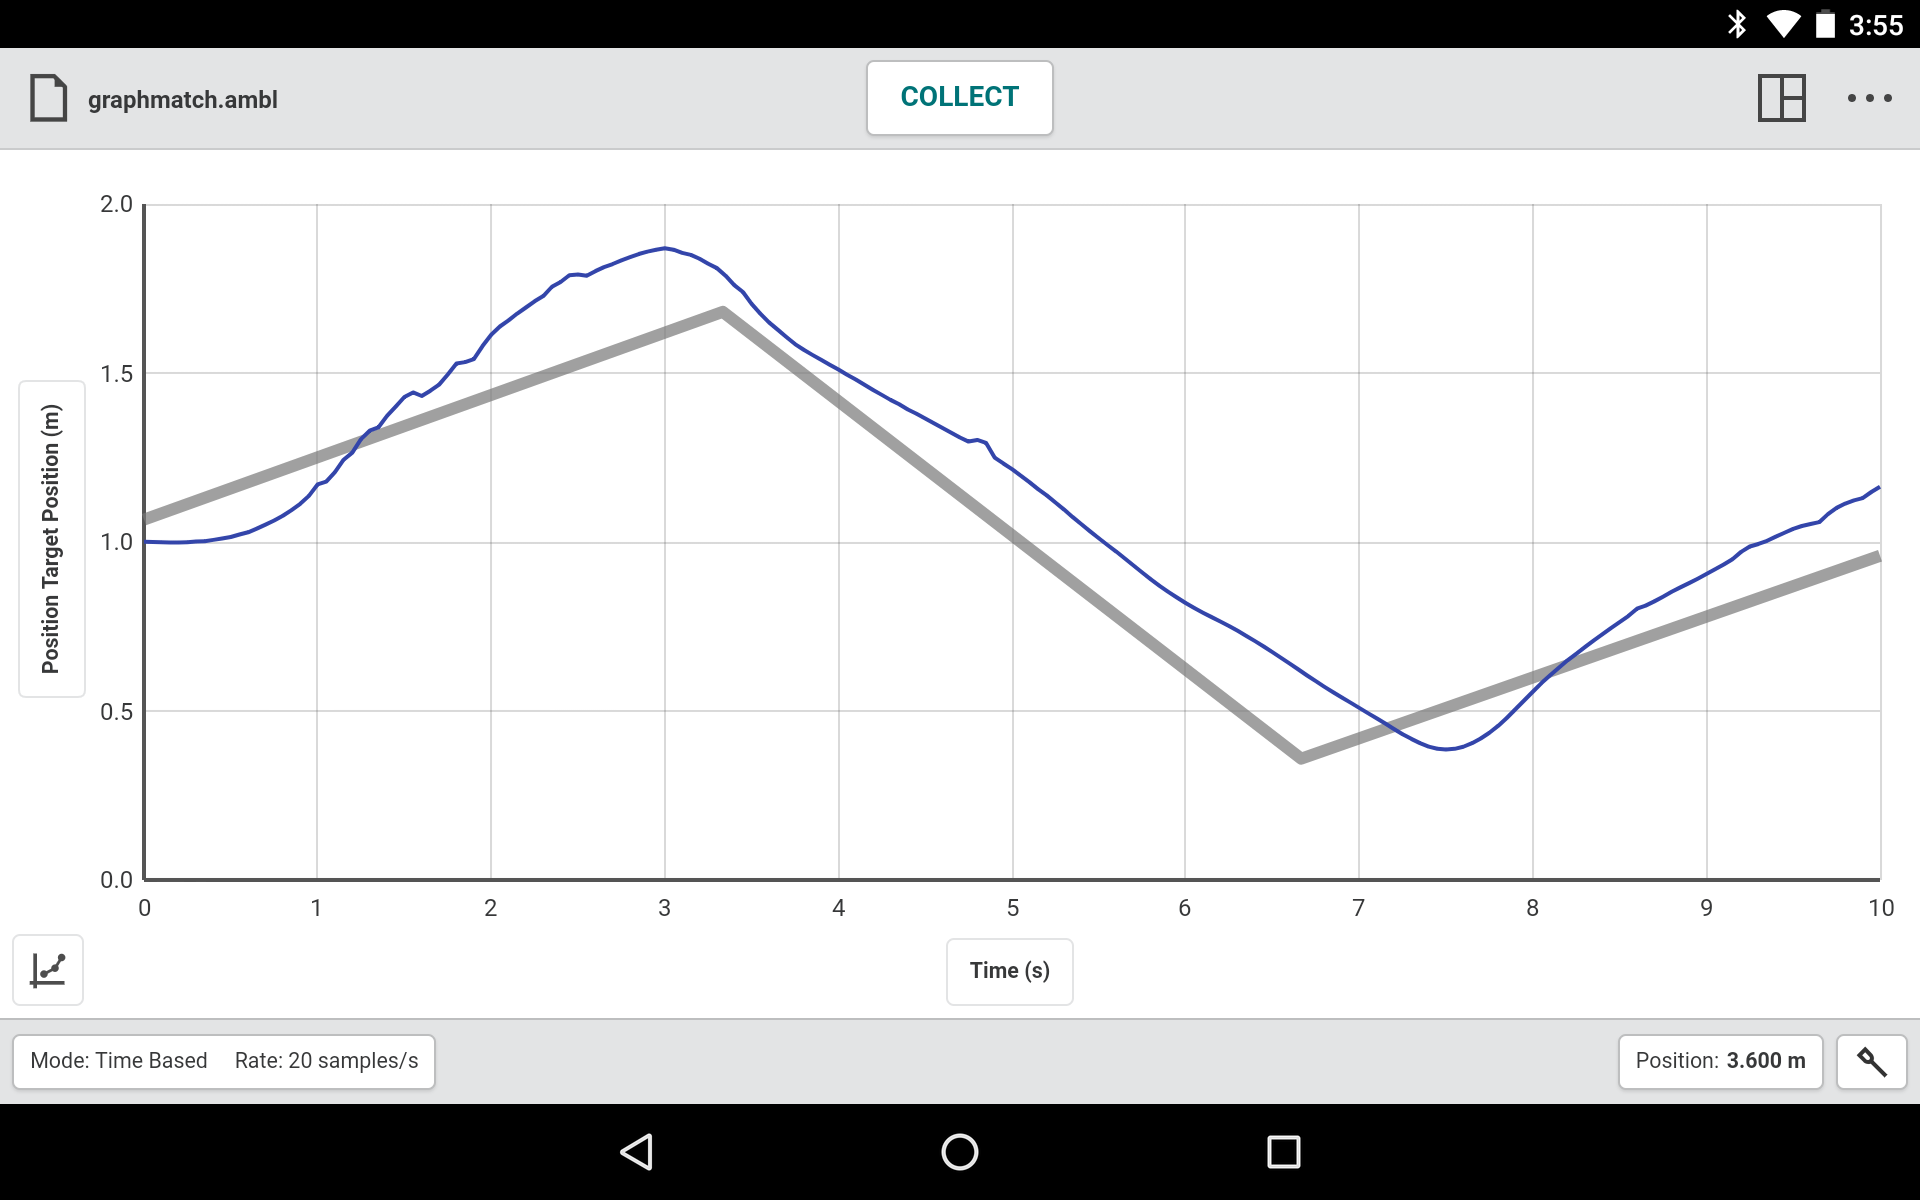
Graphical Analysis™ is a tool for science students to collect, graph, and analyze data from Vernier sensors. Sensor data-collection support: • Vernier Go Direct® sensors - with Bluetooth® wireless technology • Vernier Go Wireless® Heart Rate and Go Wireless Exercise Heart Rate monitors Additional experiment options: • Data Sharing via Wi-Fi connection to LabQuest 2, LabQuest 3 or Logger Pro® 3 • Manual Entry Note: Sensor data collection and Data Sharing require the purchase of hardware from Vernier Software & Technology. Manual entry of data can be performed without a hardware purchase. For more information on Data Sharing, visit http://www.vernier.com/css Key Features - Data Collection • Multi-sensor data-collection support • Time Based, Event Based, and Drop Counting data-collection modes • Configurable data-collection rate and duration for time-based data collection • Optional triggering of time-based data collection based on sensor value • Customizable unit display on supported sensors • Sensor calibrations • Option to zero and reverse sensor readings • Graph match feature for use with motion detectors • Manual entry of data from keyboard and clipboard Key Features - Data Analysis • Display one, two, or three graphs simultaneously • View data in a table or show a graph and table side-by-side • Draw Predictions on a graph to uncover misconceptions • Examine, interpolate/extrapolate, and select data • Use Tangent tool to show instantaneous rates of change of the data • Find area under a curve using the Integral tool • Apply Statistics calculations to find mean, min, max, and standard deviation • Perform curve fits, including linear, quadratic, natural exponent, and more • Add calculated columns based on existing data to linearize data or investigate related concepts Key Features - Collaboration and Sharing • Create text annotations and add graph titles • Export graphs and data for printing and inclusion in lab reports • Save files (.ambl file format) to the Cloud for exchange with Graphical Analysis on other Android™ devices, Chromebooks™, Windows® and macOS® computers, and iOS devices • Export data in .CSV format for analysis of data in spreadsheet software such as Excel, Google Sheets, and Numbers • Adjust font sizes for easier viewing when presenting to your class Vernier Software & Technology has over 35 years of experience in providing effective learning resources for understanding experimental data in science and math classrooms. Graphical Analysis is a part of the extensive system of sensors, interfaces, and data-collection software from Vernier for science and STEM education.
Graphical 6.1.0 Update
[NEW] Interact directly with the graph axes to change the scaling [NEW] Graph legend visibility improved [NEW] Threshold triggering when remote logging. Requires hardware [FIX] Creating a prediction no longer interferes with analysis [FIX] Photogate configuration properly restored from a saved file [FIX] CSV file import stable on all platforms
[NEW] Interact directly with the graph axes to change the scaling [NEW] Graph legend visibility improved [NEW] Threshold triggering when remote logging. Requires hardware [FIX] Creating a prediction no longer interferes with analysis [FIX] Photogate configuration properly restored from a saved file [FIX] CSV file import stable on all platforms
[NEW] Interact directly with the graph axes to change the scaling [NEW] Graph legend visibility improved [NEW] Threshold triggering when remote logging. Requires hardware [FIX] Creating a prediction no longer interferes with analysis [FIX] Photogate configuration properly restored from a saved file [FIX] CSV file import stable on all platforms
• [NEW] Rename Data Set in Y Axis popup • [PRO] Manual curve fits with draggable lines • [PRO] Notes field • [NEW] Sharing for Android • [FIX] Savitzky-Golay smoothing functions
• [FIX] Spirometer (SPR-BTA) and Blood Pressure (BPS-BTA) sensors now display live rate data correctly. • [FIX] Photogate: Gate 1 and Gate 2 state meters now display reliably.
• [FIX] Photogate: Linear Motion and Angular Motion calculated columns use correct step value • [FIX] Photogate: Graph setup for Pulse timing uses correct column for y axis • [FIX] Heart rate monitor rate() function calculations and beats per minute have been corrected
APKFab.com and the download link of this app are 100% safe. All download links of apps listed on APKFab.com are from Google Play Store or submitted by users. For the app from Google Play Store, APKFab.com won't modify it in any way. For the app submitted by users, APKFab.com will verify its APK signature safety before release it on our website.