distabs (Package Name: com.allweissconsulting.distabs) is developed by Marcus Academy and the latest version of Statistical Tables 3.8 3.7 was updated on October 31, 2025. Statistical Tables 3.8 is in the category of Education. You can check all apps from the developer of Statistical Tables 3.8 and find 56 alternative apps to Statistical Tables 3.8 on Android. Currently this app is for free. This app can be downloaded on Android 8.0+ on APKFab or Google Play. All APK/XAPK files on APKFab.com are original and 100% safe with fast download.
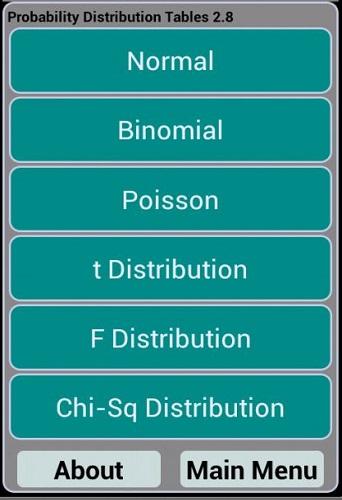
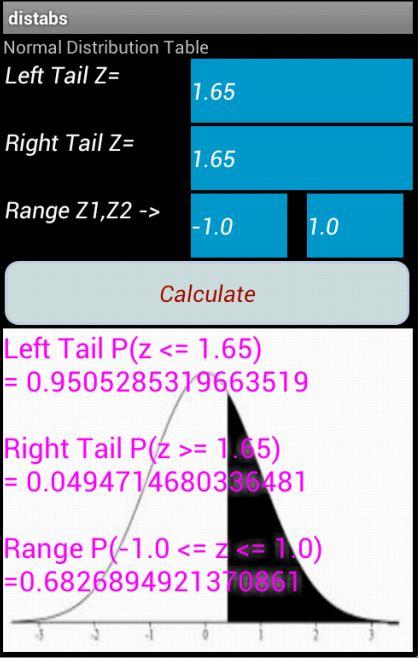
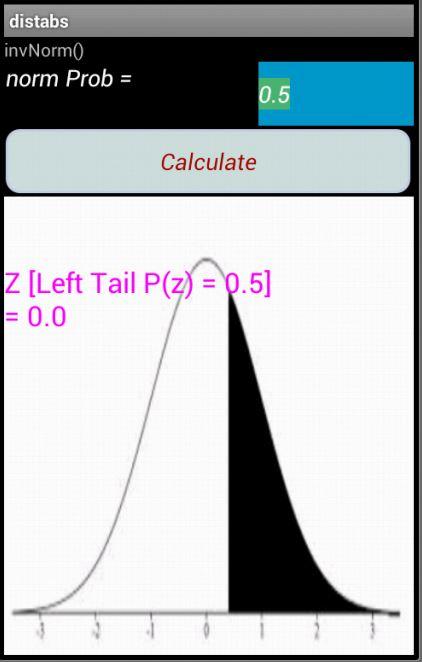
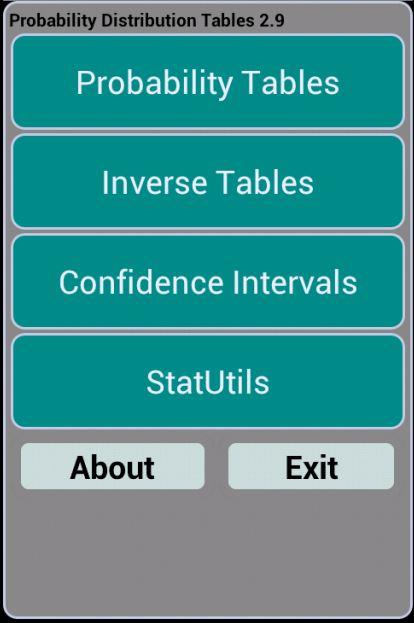
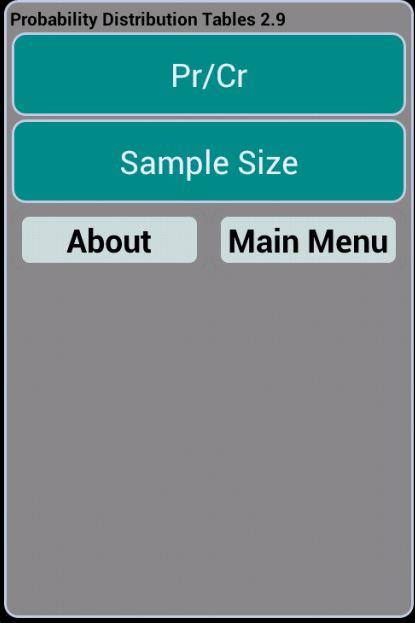
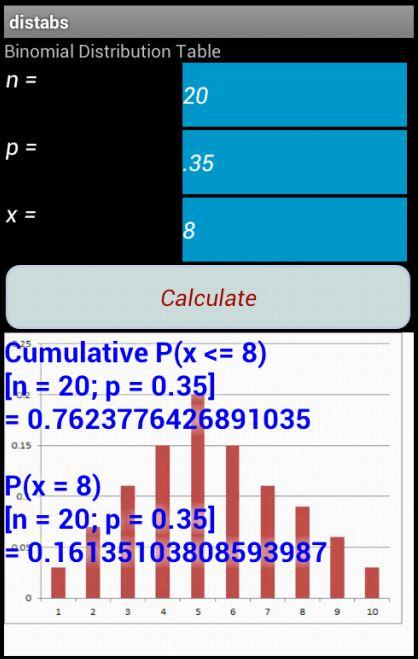
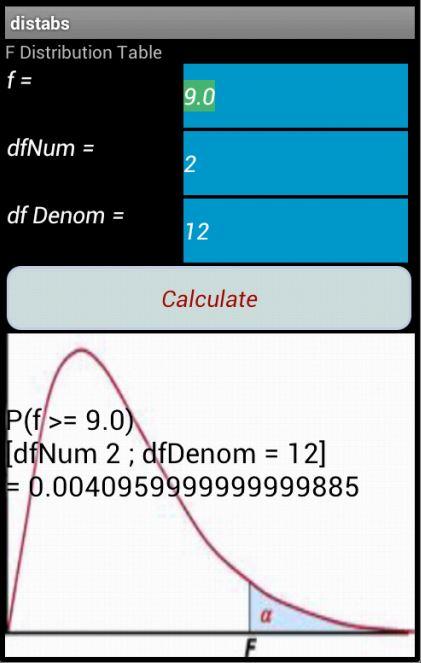
Version 3.8 changes: Update to Android 13 (API Level 33) Version 3.7 changes: Up to date Build of APP. March 27 of 2023 Version 3.7 changes: Up to date Build of APP. August of 2020 Version 3.2 changes: Up to date Build of APP. July of 2019. Version 3.1 changes: Now you can choose to show or omit background graphs on the Probability Table text views. Choose how you want it on the About Screen. Also, you can now copy the Probability Table text results from the answer in the Probability Table text views. Version 3.0 includes: Hypothesis Test Mean (Sigma Known, Sigma Unknown, Proportion). Inference Test Formulas for 2 Populations - Means and Proportions. Version 2.9 Add Permutations and Combinations. Add Sample Size Calculation. Convenient, Accurate, Easy to Read electronic Probability Distribution Tables. Normal, Binomial, Poisson, T and F Distributions. Also, invNorm and invT calculations. Contains calculators for Confidence Intervals (Sigma Known, Sigma Unknown, Proportion). Contains calculators for Permutations and Combinations, and Sample Size. Updated to include: Hypothesis Test Mean (Sigma Known, Sigma Unknown, Proportion). Inference Test Formulas for 2 Populations - Means and Proportions. Great for Intro Probability Statistics courses, or if you just need these tables! For both Phone and 10' tablets. These tables give you the probabilities associated with your test statistics and parameters. To use these tables, just select the distribution you want, and put in the test statistic and parameters, and the APP tells you the related probability. ************************************* 1) For the Normal Distribution: Enter your Z Score, and you get the left, right tails and the range. 2) For the Binomial Distribution: Enter n - number of trials, p - probability of success, x - number of successes and you get the probability of x, or the cumulative probability for x. 3) For the Poisson Distribution: Enter the mean, and number of occurences, and you will get the Probability of the number of occurences, and the cumulative probability. 4) For the t Distribution: Enter t and the Degrees of Freedom and you will get the probability of the left and right tails, and the two tailed probability. 5) For the f Distribution: Enter the f statistic, and the Degrees of Freedom for the numerator and denominator. You will get the probability for the right tail (alpha for the ANOVA test). 6) For the Chi-Square Distribution: Enter Chi-Square and the Degrees of Freedom and you will get the probability of the right tail. 7) Inverse Normal. Enter the probability of the Normal Distribution left tail, and you get the Z statistic. 8) Inverse t Enter the probability of the t distribution left tail, along with the degrees of freedom, and you will get the t statistic. Confidence Intervals: Sigma Known. Uses the standard CI formula (Using Z) to determine the range with CI% chance of containing the true mean of the population. Sigma unKnown. Uses the standard CI formula (Using t) to determine the range with CI% chance of containing the true mean of the population. CI for a proportion. Uses the standard CI formula (Using p,n,Z) to determine the range with CI% chance of containing the true mean of the population. StatUtils: Permutations and Combinations give number of ways to select n Items out of N Items. In Permutations Order of selected Items matters, in Combinations it does not. Sampling is without replacement. Sample size n, is number needed for CI with following parameters: alpha - CI between 0 and 1.0 sigma - Known standard deviation. E - desired error. Formula is: n = (Z^2 * s^2) / E^2 Z is Z score for (1-alpha)/2 Free, but please visit this APP in the Google Play store to Rate and enter comments. This will help us improve the APP over time. Please note: Due care is taken in creating this APP. However no warranty is intended or implied.
APKFab.com and the download link of this app are 100% safe. All download links of apps listed on APKFab.com are from Google Play Store or submitted by users. For the app from Google Play Store, APKFab.com won't modify it in any way. For the app submitted by users, APKFab.com will verify its APK signature safety before release it on our website.